Google is constantly changing, and in October 2021, the company announced one of the most significant changes to Google Analytics ever: the release of Google Analytics 4 (GA4). In this complete guide, you’ll learn about the features and benefits of GA4 and ways how to get started using it today.
What is Google Analytics 4?
Formerly known as “App + Web,” Google Analytics 4 is a new kind of property that uses a significantly different data structure and collection logic than the Universal Analytics property you’re used to. With an event-based model, GA4 processes each user interaction as a unique event rather than measuring sessions and grouping user interactions together. The focus on events enhances flexibility and user behavior prediction with reports like cross-platform and pathing analysis.
GA4 Machine Learning
The GDPR privacy laws in force across Europe has made it more difficult to use cookies to track visitors on your website. Firefox and Safari have already blocked third-party cookies by default, and Google plans to follow suit by 2023.
Fortunately, GA4’s machine learning renders cookies obsolete. Google’s AI-powered insights automatically alert you to data trends and provide access to predictive metrics so you can identify actions and events that are most likely to lead to conversions. These insights include
- Purchase probability—the probability that a user who was active in the last 28 days will make a purchase in the next seven days
- Churn probability—the probability that a user who was active in the last 7 days will become inactive in the next 7 days
- Revenue prediction—the predicted revenue from purchases in the next 28 days from users who were active in the previous 28 days
With these metrics, you’ll be able to anticipate your visitors’ actions and use this insight to customize marketing campaigns and target higher value audiences.
Should I switch from Universal Analytics?
With the announcement that Google will sunset its Universal Analytics properties starting in July 2023, it is important to start utilizing GA4 now to enhance the data you are collecting. Switching early will also provide you time to get used to the platform while you still have traditional analytics to fall back on.
GA4 Event Tracking
With the shift to user-focused interactions, you’ll notice almost all data points in GA4 are labeled as events. This is intentional but can be confusing until you get used to it. Now each session and page view is an event that contains additional details. For example, with GA4, you see a page view event in addition to information such as page location, page referrer, and page title. All this information was available in Universal Analytics but had to be accessed from separate reports that were often hard to cross-analyze.
How does this help you? The focus on single interactions makes it easier to follow the user’s journey across your website. Setting up specific events also allows you to identify specific predicted user interactions before they occur. The more events you can track, the better GA4 can predict user behavior across your site.
Events are grouped into four main categories:
- Automatically Collected Events—Google collects by default when you set up and install GA4 on your website or app.
- Enhanced Measurement Events—Google collects from websites when enhanced measurement is enabled.
- Recommended Events—Google recommends predefined names and parameters, and you implement them manually. When created, these events unlock existing and future reporting capabilities.
- Custom Events—You create and define these events. It is recommended to create custom events only when no existing event categories fit your use case. Custom events don’t show up in most standard reports, so you will need to set up custom reports to conduct meaningful analysis of custom events.
Now, we’ll take a closer look at each of these event categories to help you understand how to configure them and how to identify the best category for your purpose.
Automatically Collected Events
These events are triggered by basic interactions with your app or website. As long as you have the GA4 tracking code firing on your website or app, you do not need to configure additional settings or write any additional code to collect these events. Some common automatically collected events include
- Click—each time a user clicks a link
- Session start—when a user engages the app or website
- First visit—the first time a user visits a website or launches an app
You can find Google’s complete list of automatically collected events here.
Enhanced Measurement Events
When you configure a data stream in GA4, you have the option to enable enhanced measurement. This is designed to help marketers see as many events as possible in their reports without the need for manual configuration in Google Tag Manager or the help of a developer. To enable enhanced measurements, go to Admin > Data Streams > Select the web data stream. On the next window, ensure the toggle in the enhanced measurement section is on. This feature is enabled by default and will track the following events:
Page view—each time the page loads or the browser history state is changed by the active site
Scroll—the first time a user reaches the bottom of each page (i.e., when a 90% vertical depth becomes visible)
Outbound link click—each time a user clicks a link that leads away from the current domain
If your company operates on multiple domains, you can go into the Tagging Settings (of the same event stream) and enter all the domains of your business. As long as all domains are listed, they will not trigger the outbound link click event.
View search results—each time a user performs a site search, indicated by the presence of a URL query parameter such as q, s, search, query, or keyword.
You can enter up to ten search term query parameters and up to ten additional query parameters. For example, if the address of your website’s search results page URL is https://www.examplesite.com/search?key=their+search+term, then it is recommended to add the word key to the parameter list. Similarly, if the URL for the results page is https://www.examplesite.com/search?key=search+term&results=50, you might want to add results in the additional query parameter list.
Youtube Video Engagement—tracks start, progress (10%, 25%, 50%, and 75%), and complete
To track YouTube video engagements, the embedded YouTube video player needs to include the ?enablejsapi=1 parameter in the URL. This is not always available on websites, so these events may not work out of the box for you and will likely require some tweaking within Google Tag Manager.
File download—when a user clicks a link leading to a file (document, text, video, etc.)
You can individually disable or enable these events by clicking the settings icon next to the measuring section. When enhanced measurements is enabled, GA4 will track these events for you. With these and the automatically collected events, you’ll have a good foundation for viewing and tracking user engagement on your website or app, but you can collect even more by using additional event categories.
Recommended Events
By default, GA4 automatically collects basic event data such as page views, first visits, and session starts. Additionally, the GA4 data model is more flexible, has fewer restrictions, and fewer required fields or parameters than Universal Analytics when it comes to creating custom events. For example, in Universal Analytics, you could send the following four parameters with each event:
- Event Category (required)
- Event Action (required)
- Event Label (optional)
- Event Value (optional)
Within your Universal events report, you’d be able to see the event category and click to drill down deeper into the additional parameters.
GA4 has a more flexible naming convention and depends solely on you (or the person implementing the tracking setup). GA4 has a parameter for event name, but everything else you collect depends on your plans. You don’t have to send any additional parameters with the event name, or you can choose up to four additional parameters to add context to that event. For example, if a website visitor fills out your “Schedule a Consultation” form, you could send the following event:
- Event Name: schedule_consultation
- Service_name: website_redesign
- Company_industry: fintech
- Company_size: 50-100
- Annual_revenue: 10-50M
Those last four details above are custom parameters. Keep in mind you can only create 500 custom event parameters per app instance, and character limitations apply.
While it is exciting to have the flexibility to create any events you want, Google has an extensive list of recommended events for different industries:
- Generic (for all properties)
- Online sales
- Games
Before you create a custom event name, we recommend checking first the automatically tracked events and the enhanced measurement events. If none of the events in those categories cover your event use case, take a look at Google’s recommendation list next.
Whenever possible, it is beneficial to use Google’s recommendations to help GA4 better understand your data and apply it to their machine learning capabilities. After all, Google has already programmed its AI to consider these types of events and once implemented, they will quickly be able to gather beneficial insights for your business.
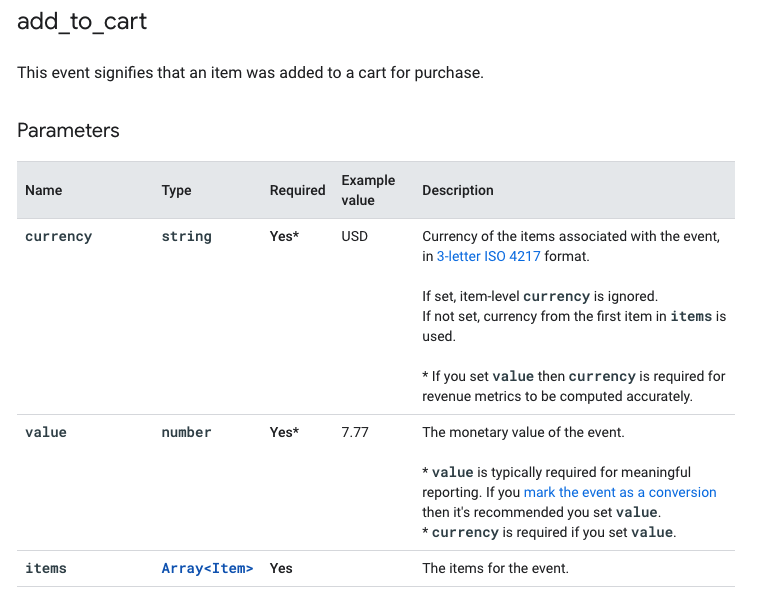
For example, if you want to track when a user adds an item to their cart in your online store, you will see Google has a corresponding event in the online sales list.
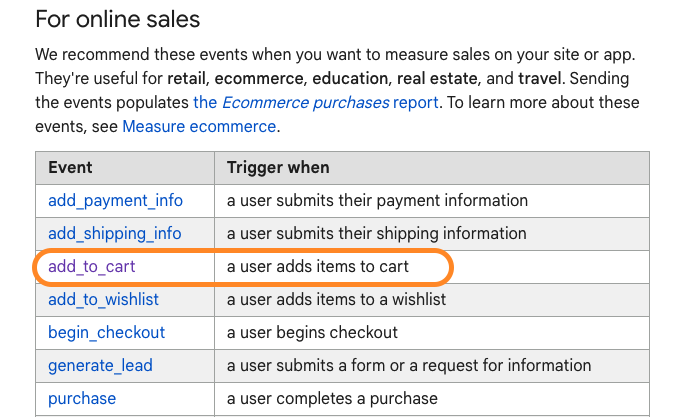
When you click on the recommended event from Google’s list, you’ll also see recommended parameters to include with your event.
While Google provides helpful ideas for events to get you started, each of these recommended events needs to be setup manually, which can sometimes require the assistance of a developer.
Custom Events
If none of the automatically tracked or recommended events fits your desired event type, you can create and track custom events. The configuration is nearly identical to that of recommended events, but you will need to determine the event name yourself.
While GA4 offers a lot of flexibility when it comes to creating new events, as mentioned above, limits to the event name length and the number of unique event names per GA4 property. Google will not allow you to track new events if you reach the 500-count limit. Use caution when creating new events! At the time of this article’s publication, Google does not allow you to delete unused events.
How To Modify Events in GA4
If you discover a misspelling in an event name or a duplicate event, you can easily modify the event by navigating to Configure > Events and clicking Modify event. After you click Create, you will be able to
- Give your modification a name (internal use only)
- Specify the matching condition GA4 should look for
- Enter the necessary modifications
From there, if GA4 finds an event matching the conditions you’ve specified, it will automatically adjust its name to the modified version you indicated.
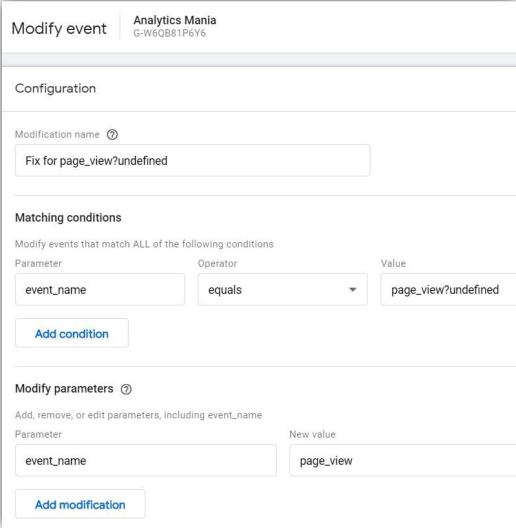
After saving your changes, you can test the edits in the Realtime report and debug view. You can create up to 50 modifications per property, and any changes will apply only to new data; historical data won’t be impacted.
Testing Events
After you configure any event in GA4, it is a good idea to test it using GA4’s built-in debugging functionality. To find the debug tool, navigate to Configure > DebugView. The data shown in the debug tool will look very similar to data shown in the Realtime report.
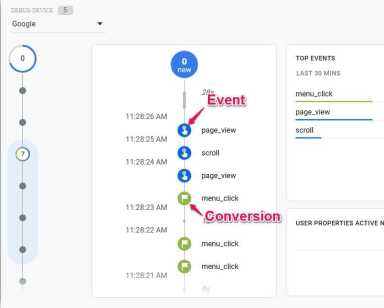
GA4 distinguishes events in blue and conversions in green. As you click on events or conversions, you will see the additional parameters that were sent with the event to the right of the event timeline.
Debugging is an important step to take prior to publishing any changes in your Google Tag Manager container to ensure all data coming in is correct and displaying properly. Once you publish changes, your new event data will start to appear in your Realtime reports. Now that you have a strong understanding of event tracking in GA4, you can use those events to further build your reporting by incorporating conversions.
Conversion in GA4
Conversions mean something different to everyone and often vary greatly between industries. Generally speaking, a conversion is an important action you want your visitors to complete. Conversions can be sorted into two categories: micro-conversions and macro-conversions.
- A micro-conversion is an interaction that moves the user closer to a macro-conversion. Examples include subscribing to a newsletter, downloading an ebook, and other top-of-funnel interactions with your website content.
- Macro-conversions are your most important actions, such as purchases on e-commerce sites or contact form submissions requesting services.
The benefit of tracking conversions in GA4 is that it helps you better understand what elements of your site are more or less successful in generating conversions.
Goals vs. Conversions
If you were familiar with Universal Analytics, you may have used goals to track desired interactions with your website. In GA4, these are conversions. It is worth noting that GA4 limits you to 30 conversions per property, an increase from Universal’s 20 goals per view. Similar to the event's configuration above, conversions in GA4 come pre-defined but also allow you to create your own if needed.
Predefined Conversions
There are only five events that GA4 designates as conversions that you cannot alter. Those include
- Purchase (website & app)
- First open (app only)
- In-app purchase (app only)
- App store subscription convert (app only)
- App store subscription renew (app only)
As you can see, four of the five pre-defined conversions apply to mobile applications, leaving you with a lot of freedom to configure your own website conversions from your events.
If you only connected the web data stream when you created your GA4 property, then purchase will be the only default conversion available to you in the conversion report. If you connected any app data streams, you will see the other pre-defined conversions as well. Even though GA4 does not provide many out-of-the-box conversions for web data streams, they make it easy to convert your established events into conversions.
Create Conversions from Events
There are two ways to set already created events as conversions. The first option is to navigate to Configure > Events and switch the mark as conversion toggle for the desired event.
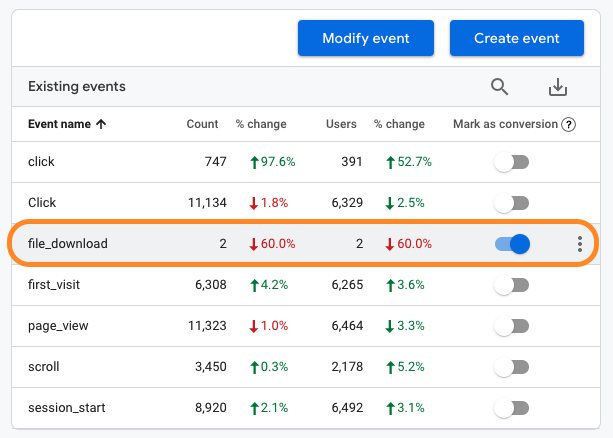
The other option is to navigate directly to Configure > Conversions, click New conversion event, and enter the name of the event you’d like to make a conversion. The only difference between the two approaches is that the toggle option may take up to 24 hours before the event name displays on your conversions page.
Reporting with GA4
Realtime Report
The Realtime report allows you to see events that happened in the last 30 minutes (substantially longer than Universal Analytics’ 5 minutes). With this report, you’ll be able to see how many users have visited your site in that 30-minute timeframe, the devices used, the sources driving that traffic, a breakdown of audience type, the top viewed pages, top events, and (if enabled) conversions and properties.
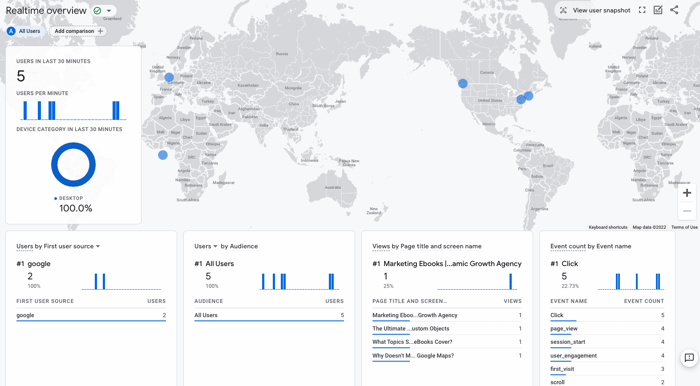
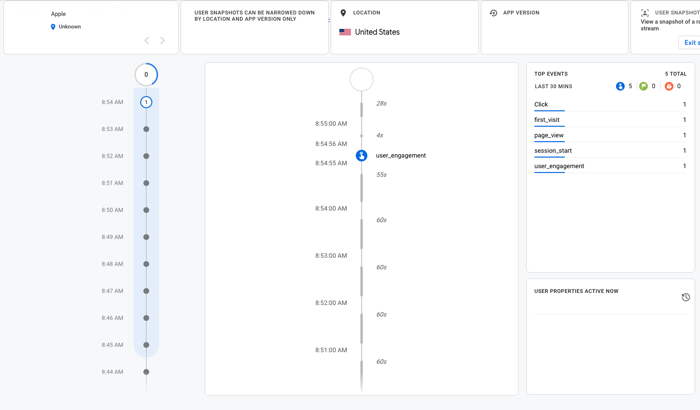
User Snapshots
An exciting feature of the Realtime report is the user snapshot, which you can access from the top right corner. The user snapshot shows a granular view of a random user’s journey on your site. GA4 will tell you their location and device type as well as a timeline of the events they triggered during their visit, allowing you to see how active users are on your page.
User Lifecycle Reporting
Lifecycle reports break down the user funnel with reporting of acquisition, engagement, monetization, and retention. Use these reports to discover how users enter your site, how they behave once they enter the funnel, and more. Many of the information available under lifecycle and user reports are similar to that available in Universal Analytics, but in the context of events rather than sessions or page views. You can explore all the reports within the various tables and click on events or segments of reports to dive deeper into the data.
While GA4 provides many reports out of the box, you may find you want to see certain types of events grouped together or explore user engagement from specific segments of your audience. Luckily, GA4 allows you to easily create your own reports to further refine the data you see.
Creating a New Analysis Report in the Explore Tab
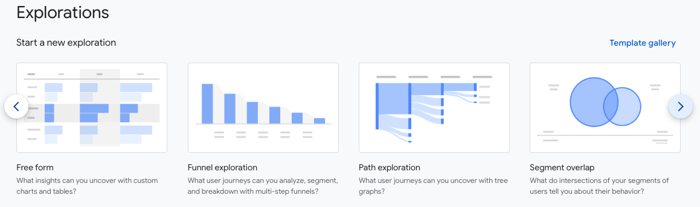
Much like Universal Analytics, GA4 allows you to create custom reports to further segment the data you’re tracking or narrow your focus on certain pages and interactions. When you navigate to Explorations, you can choose a report template to get started or begin with a blank report.
When you click into a report, you will see a report builder that makes it easy to configure the data you want to see. Let’s break down an example:
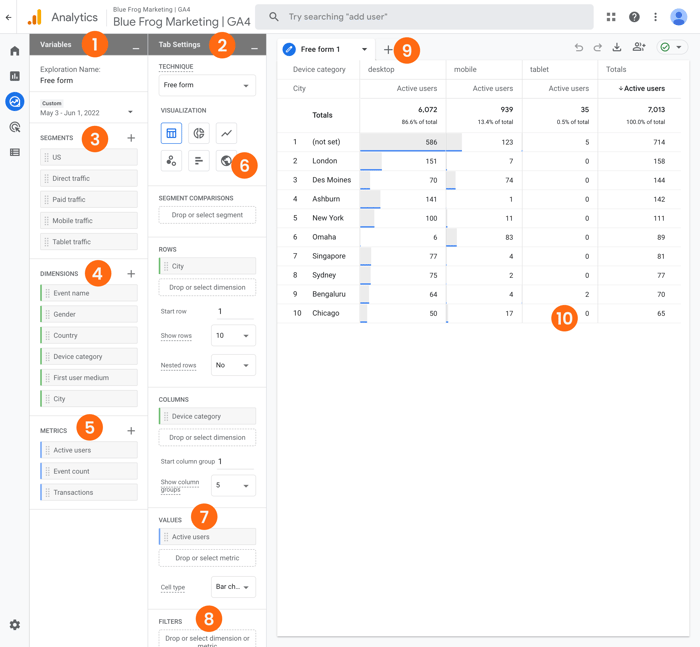
- Variables Section—Select all the data points you want to report on that fall within segments, dimensions, metrics, and the overall report date range.
- Tab Settings Section—Determine how the report will be configured and further segment the data shown.
- Segments—Drag the groups into your report to narrow the focus on a specific segment of users. If you don’t see the segment you want, click the plus button above the list to find more options.
- Dimensions—This is the information you want a analyze. Drag your desired dimensions into rows or columns to add data to your report.
- Metrics—Add metrics into the values section of the tab settings to configure the numeric values of your report.
- Visualization—Here you can choose you report layout. Options include pie charts, free-form tables, line graphs, and more.
- Values—This is where your metrics will be added. Choose the cell type to adjust how the columns are displayed, such as heat maps, bar charts, or plain text.
- Filters—Add additional metrics here to further narrow the scope of your report. Filter by elements like traffic source, device type, or page path.
- Tabs—Toggle between different visualizations. You can add up to ten tabs at a time.
- Display—Interact with the data in the visualization by right-clicking a data point.
Types of Analysis
You have several types of custom reports to choose from in GA4. Explore the types below to better understand what reports you might want to configure for yourself.
Free-Form Report
The free-form report allows you to have more control over how your data is presented visually and get very granular on the data used within the report. A unique new feature within this exploration report is anomaly detection. This feature automatically flags data points that are outside the expected outcome. As you collect data over time in GA4, this feature will become more accurate.
Funnel Exploration
The funnel exploration report allows you to analyze specific user journeys, segments, and breakdowns with multi-step funnels. This custom report allows you to choose each step to more accurately represent desired user pathways throughout your website or app.
Path Exploration
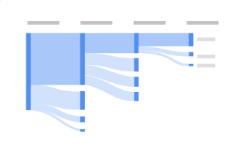
Similar to the behavior flow reports in Universal Analytics, the path exploration report takes funnel path analysis a step further with event streams called “tree graphs.” This allows you to see all the next steps users took after certain interactions with your website. Use this report to better understand looping behavior, where visitors get stuck, and where they drop off their path to conversion.
Segment Overlap
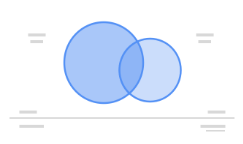
Segments in GA4 can incorporate user events or sessions; for example, you could segment your users by a specific city, visits to a specific page, or those who completed certain actions. With the segment overlap report, you can identify intersections between your various user segments to learn more about their behavior.
User Explorer

The user explorer report allows you to discover individual behaviors by drilling into specific actions and activities taken by individuals on your website or app.
Cohort Exploration
Cohorts are groups of users who have common characteristics. For example, you could create a cohort of users with the same acquisition date or same conversion event. Use the cohort exploration report to discover insights about certain cohort behavior, such as how long it takes people from the same marketing campaign to convert.
User Lifetime
One of the most impactful reports for search marketers is the user lifetime report because it allows them to visualize sources that drive users with the highest lifetime revenue value. Use this report to identify which marketing campaigns acquire the most valuable users, lowest churn, and highest purchase probability. This report will become more insightful and accurate over time as GA4’s built-in AI technology learns and analyzes your user behaviors.
Get Started with GA4
While learning a new platform and changing the way you visualize and track data from your website or app may seem like a huge undertaking, it is clear that this is the future of data tracking with Google. The sooner you adopt GA4, the easier it will be to transition your reporting practices when Google ceases data collection in Universal Analytics in July 2023.